Manual
Online Version
The online version of DistAMo provides an easy-to-use approach for analysis of a DNA motif distribution in replicons (sizes > 50 kbp). The sequence and annotation data can either be selected by simple selection from the NCBI database list or be provided by the user in fasta and gff format. A motif is inserted as single or multiple DNA motif sequence (separated by comma). Beside A, T, G, C it is also possible to use degenerate letters as N (A or C or T or G) or W (A or T) etc. For the analysis of the leading and lagging strand motif distribution in bacterial chromosomes, the origin of replication and the terminus position need to be provided. Otherwise oriC is assumed to be at position 1 and the terminus opposite the origin (half the genome size). For many bacterial genomes the DoriC database holds the coordinates for the origin of replication and the Dif site (indicator of the terminus region). A link is provided in the form to search for the oriC position. Depending on the server load, the analysis will take a few minutes to finish. A notification and a link to the results page will be sent to your email address when the analysis has finished. The results overview shows general statistics about the analysis and the overview of the motif distribution on the different strands.
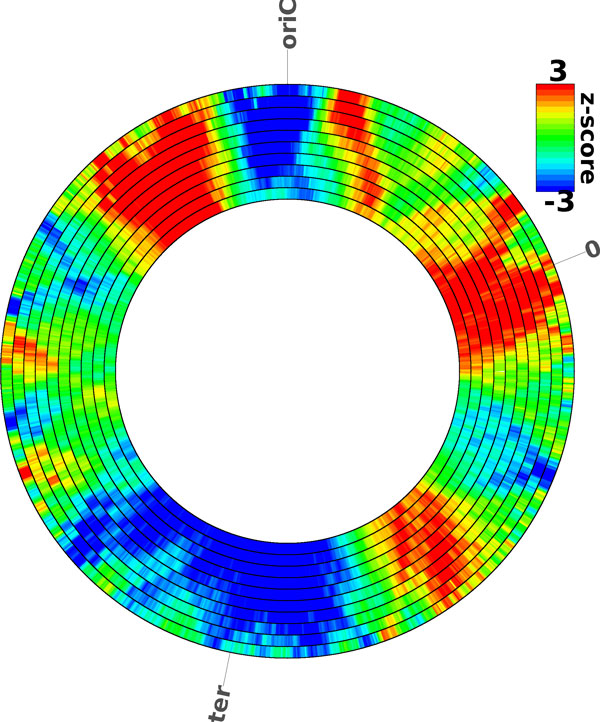
The motif distribution (Figure 1) is color-coded as indicated by the legend on the right. A z-score of 2/-2 is commonly accepted as a significant value. The different rings show the distribution using various window sizes for the calculation of the z-scores ranging from 500 kb at the inner ring to 50kb on the outer ring increasing in 50kb steps. The larger the window size the coarser grained is the analysis of the distribution. On the other hand a coarse grained analysis reveals larger regions with increased/decreased amounts of motifs. For smaller replicons between 50 and 500 kbp the window sizes range from 5 to 50 kbp in 5 kbp steps. DistAMo provides 5 figures to distinguish strands. The strand unspecific figure takes into account all motifs irrespective of the strand. In case of palindromic sequences only the motif on one strand is counted in the statistics. The other four figures take into account motifs on the leading-, lagging-, coding- and template strand separately. DistAMo, in addition, provides a list of genes that are significantly overrepresented/ underrepresented exceeding a z-score of 2/-2. The localizations of respective genes are also visualized on the chromosome in a separate figure.
All the data including figures and raw data can be downloaded as zipped file.
Stand-alone version
For more advanced analysis of DNA motif distributions in bacterial chromosomes you can download and install DistAMo on you own computer. The stand-alone version is command line based. Below we describe the respective usage. DistAMo is provided as a single compressed file that contains the DistAMo directory with all necessary files and an example. The tool can be used without installation provided java is installed. The tool can be run using the DistAMo.jar with the following command options. For all parameters also see the sample command line and files in the DistAMo/example folder.
                Input

                -f

                folder with all fasta and gff files, fasta and gff files must have the same name
                e.g.
                species.fna
                species.gff

                -o

                folder for all output files

                -m

                file with motifs to analyze. The file is two-dimensional. In the horizontal, motifs are separated by a comma and
                are treated as one motif. So AGG, TGG yields the same result as WGG.
                In the vertical, parallel motif analysis are stated.
                e.g.

                WGG
                TGG

                will analyze WGG and TGG separately but is more efficient (also on a single core) than running the program twice
                with the individual sequences.


                -ori

                File with all ori positions (tab delimited file with fasta file name and oriC position)

                -ter

                File with all ter positions (tab delimited file with fasta file name and ter position)


                -cod

                triplet to aminoacid mapping (provided)

                -sym

                degenerate DNA sequence coding (provided)

                -c

                number of cores (just for analysis of multiple motifs)

                -l

                newline separated list of gene names for the analysis of a gene subset.